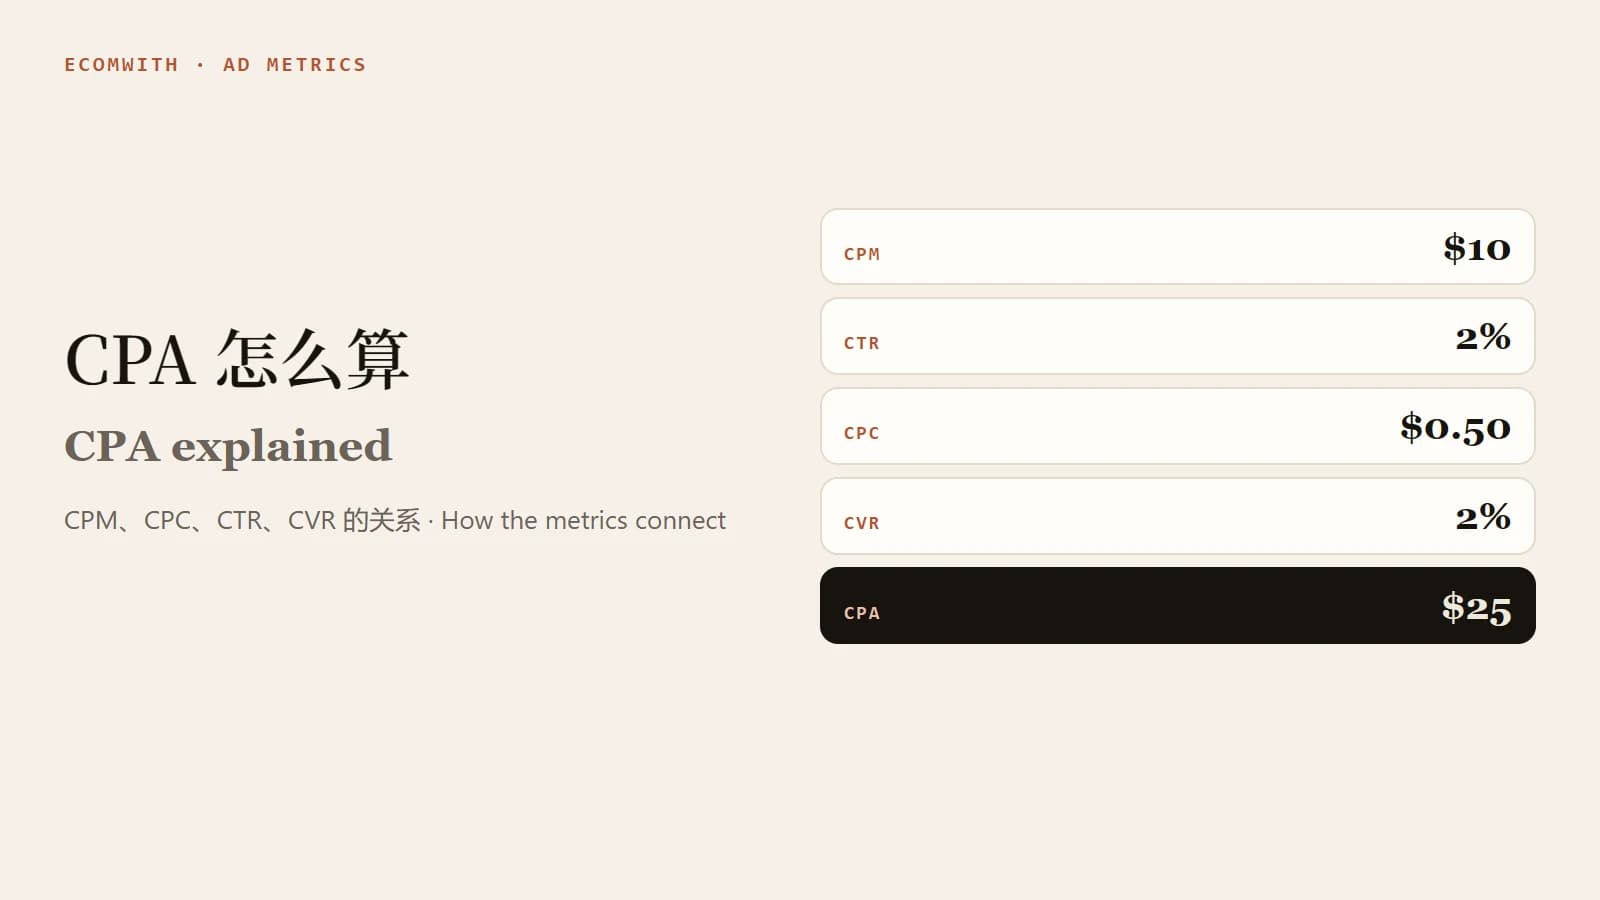
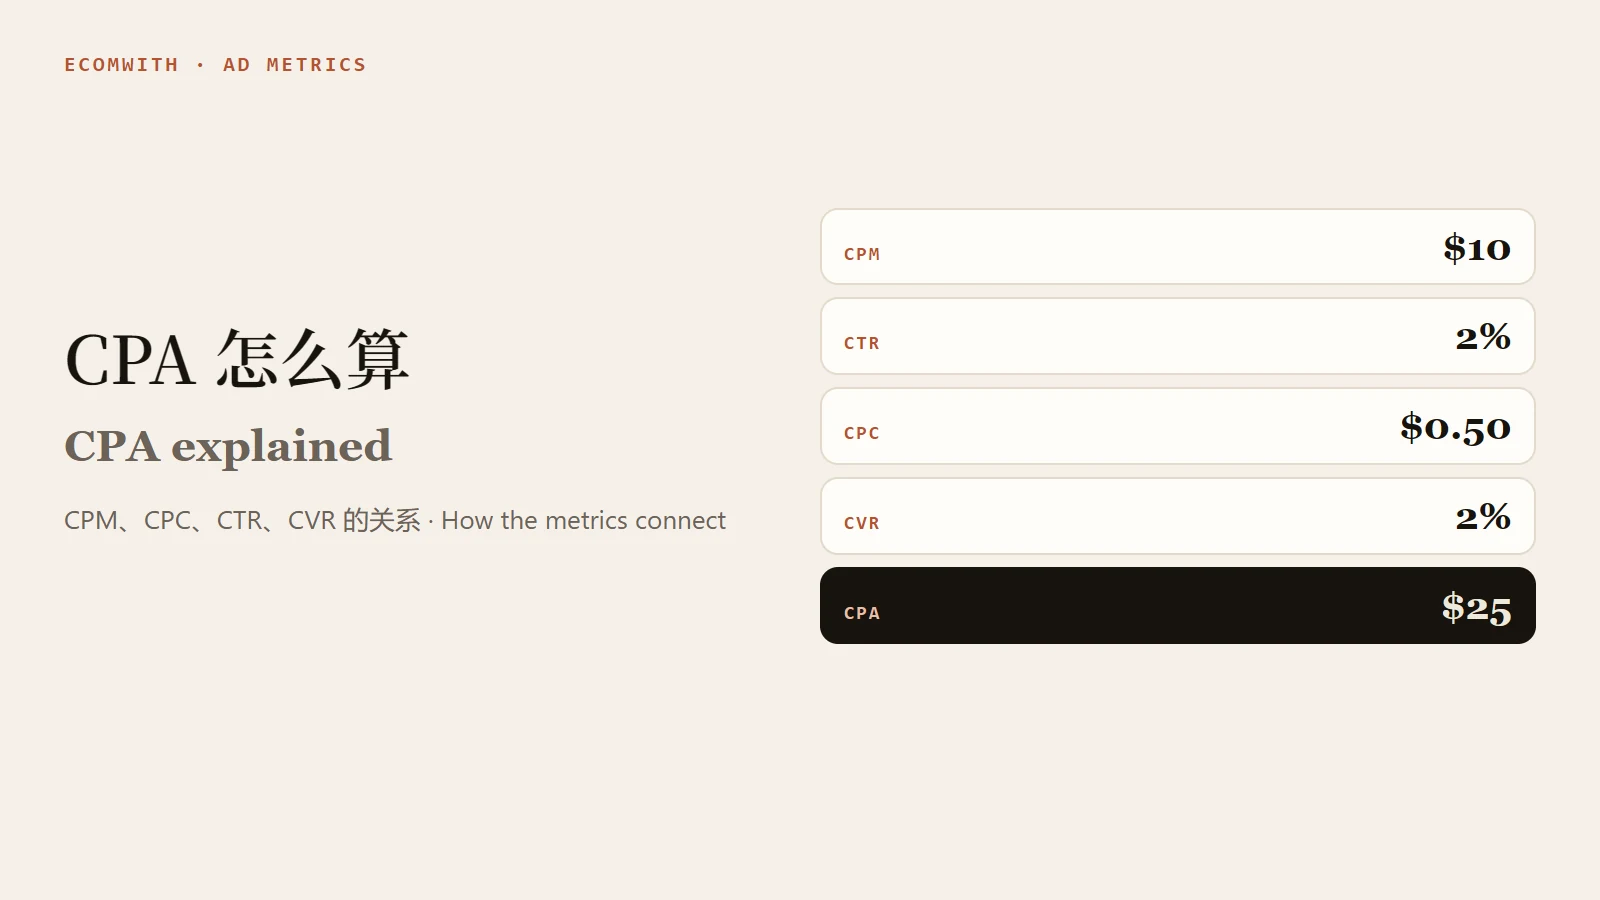
CPA, or cost per acquisition, is ad spend divided by the number of conversions. For an online store a conversion is usually an order, so CPA is what you paid in ads for each order. Three metrics decide it: CPM sets how many impressions your money buys, CTR sets how many of them become clicks, and CVR sets how many clicks become orders. Written as one line, CPA = CPM / 1000 / CTR / CVR. Whether a CPA is high or low depends on your break-even CPA, which is average order value times contribution margin, and the matching break-even ROAS is 1 divided by contribution margin.
One-line definitions
| Metric | In one line | Formula |
|---|---|---|
| CPM | Average cost per 1,000 impressions | Spend / (impressions / 1,000) |
| CTR | Share of people who saw the ad and clicked | Clicks / impressions |
| CPC | Average amount paid per click | Total cost of clicks / clicks |
| CVR | Average conversions per ad interaction | Conversions / ad interactions |
| CPA | Average cost per conversion | Spend / conversions |
These definitions follow Google Ads Help. For CPM the formula is given as cost / (impressions / 1,000). The CTR example is 5 clicks on 100 impressions, which is 5%. The average CPC example is two clicks costing $0.20 and $0.40, a total of $0.60, so $0.30 on average. The conversion rate example is 50 conversions from 1,000 interactions, 5%. Cost per conversion is total cost divided by the number of conversions.
Two details deserve care. Google's conversion rate uses ad interactions as the denominator, and clicks are only one kind of interaction. Its help page also notes the rate can exceed 100% when several conversion actions or "every" conversion counting are used. In Meta's Ads Manager, click metrics commonly come in more than one version, such as all clicks and link clicks, with matching CTR and CPC variants. We could not read Meta's metric definition pages for this article, so open the column help in your own account and compare only like with like.
The chain: CPM, CTR, CPC, CVR, CPA
Put the five metrics on one budget and each step follows from the last:
- Impressions = spend / CPM x 1000
- Clicks = impressions x CTR
- CPC = spend / clicks, which also equals CPM / 1000 / CTR
- Orders = clicks x CVR
- CPA = spend / orders, which also equals CPC / CVR
Here is a worked example in which every figure can be checked line by line.
| Step | Calculation | Result |
|---|---|---|
| Spend | Given | $1,000 |
| CPM | Given | $10 |
| Impressions | 1,000 / 10 x 1000 | 100,000 |
| CTR | Given | 2% |
| Clicks | 100,000 x 2% | 2,000 |
| CPC | 1,000 / 2,000 | $0.50 |
| CVR | Given | 2% |
| Orders | 2,000 x 2% | 40 |
| CPA | 1,000 / 40, also 0.50 / 2% | $25 |
| Average order value | Given | $60 |
| Platform-attributed revenue | 40 x 60 | $2,400 |
| ROAS | 2,400 / 1,000, also 60 / 25 | 2.4 |
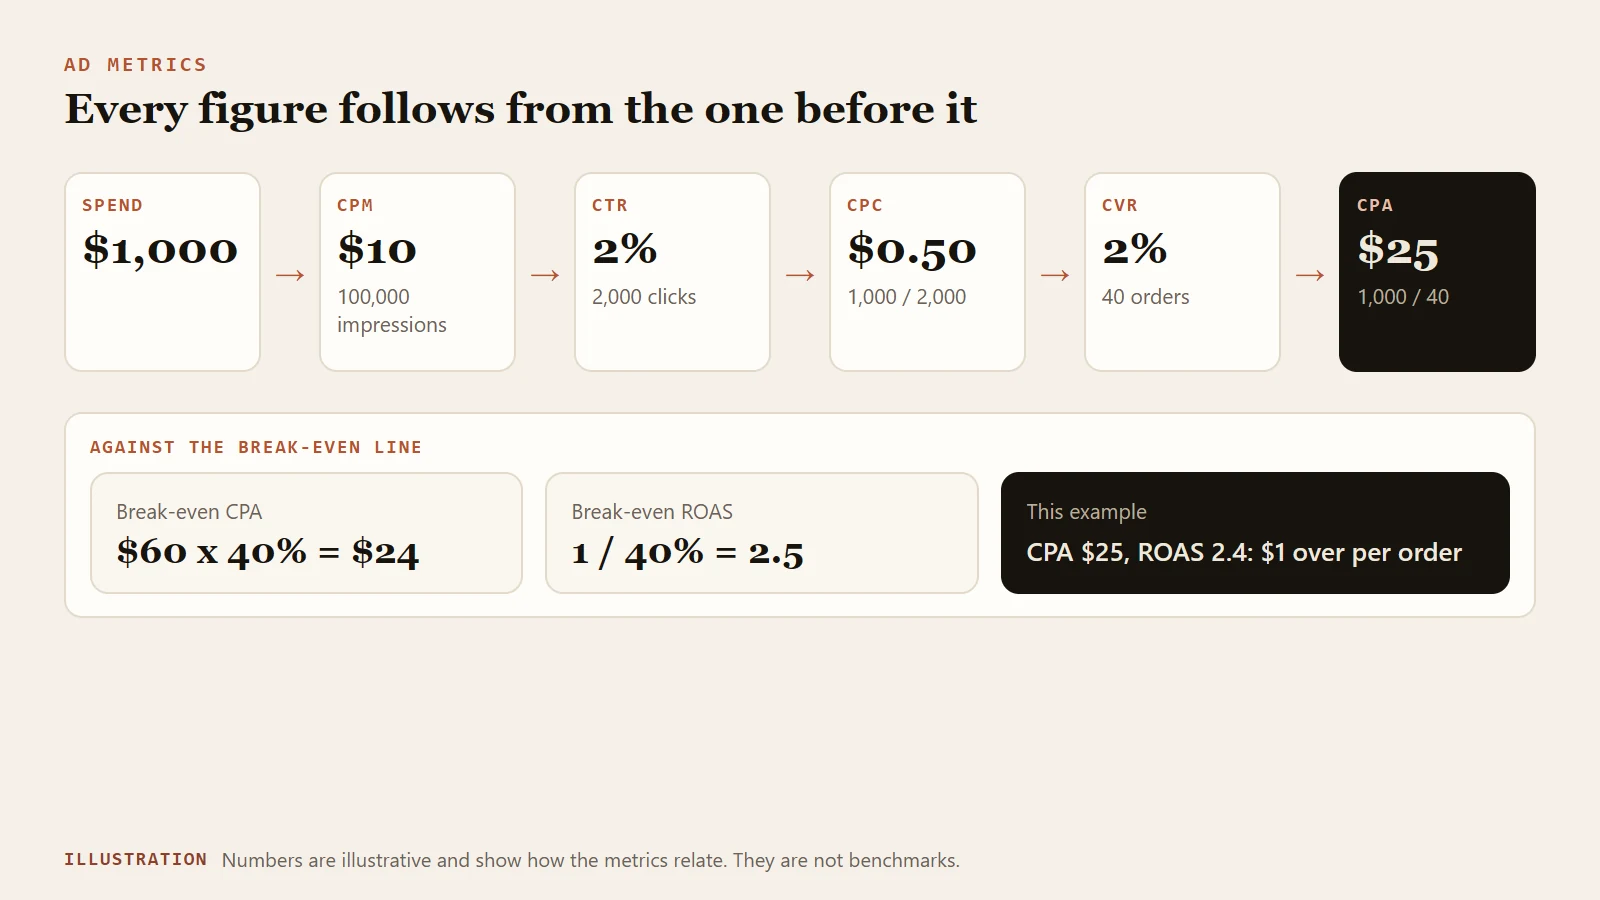
Figure 1: The chain in the example. The numbers are illustrative and show how the metrics relate; they are not benchmarks.
Change one metric at a time and CPA moves like this:
| Change | New CPC | New CPA | Versus $25 |
|---|---|---|---|
| CPM rises from $10 to $12 | $0.60 | $30 | Up 20% |
| CTR falls from 2% to 1.5% | $0.67 | $33.33 | Up about 33% |
| CVR rises from 2% to 2.5% | $0.50 | $20 | Down 20% |
CPA moves in proportion to CPM and in the opposite direction to CTR and CVR. A 30% drop in click-through or conversion rate hurts CPA more than a 30% rise in CPM does, which is why watching CPM alone falls short.
Funnel diagnosis: rules, not benchmarks
The rules below compare a campaign with its own history. Take the same campaign and the same attribution settings, and compare the last 7 to 14 days with the previous period of equal length. Public benchmarks vary widely by category, country, placement and counting method, so this article quotes none.
| What you see | Suspect first | Check first |
|---|---|---|
| CPM up, CTR and CVR about the same | Impressions got more expensive: narrow audience, high frequency, more competition, placement mix | Break CPM down by placement and audience; check frequency |
| CPM normal, CTR down | The creative or hook has lost pull | Compare how long each creative has run and its frequency |
| CTR normal, CVR down | Clicks arrive but do not buy | Does the ad promise match the landing page, is checkout failing, how does it work on mobile |
| CTR high, CVR very low | Click intent does not match, or the click definition includes low-value interactions | Confirm you are using link clicks, then look at the landing page |
| CTR low, CVR high | Few clicks but good ones, so CPC runs high | Test a stronger opening and a wider audience before calling the creative bad |
| All four look normal but CPA is above break-even | The issue is order value or margin | Work on order value, bundles or costs; changing ads helps little |
| Platform orders clearly exceed Shopify orders | Attribution settings or double counting | See the reporting traps below |
To tell a tired creative from a weak page in more depth, read creative fatigue or a page problem.
These rules give you an order of inspection. Each one only narrows the suspects, so verify with data and change one variable at a time.
Break-even CPA and break-even ROAS
Break-even CPA answers: what is the most I can pay in ads per order without losing money?
Break-even CPA = average order value x contribution margin
Contribution margin is the share of revenue left after variable costs such as product cost, payment fees, shipping subsidy and expected refunds; see contribution margin. Continuing the example with an average order value of $60 and a contribution margin of 40%:
- Contribution per order = 60 x 40% = $24, so break-even CPA = $24.
- Break-even ROAS = 1 / 40% = 2.5, which also equals 60 / 24 = 2.5, consistent with the site's break-even ROAS definition.
The example CPA is $25, which is $1 above break-even, and ROAS is 2.4 against a break-even of 2.5. The 40 orders contribute 40 x 24 = $960 against $1,000 of spend, a loss of $40. The two statements describe the same thing.
There are three ways back to break-even, each valid on its own:
- CVR rises from 2% to 2.1%, so CPA becomes 0.50 / 2.1% = about $23.81, under $24.
- CPM falls from $10 to $9.60, clicks and orders rise with it, and CPA lands at exactly $24.00.
- Average order value rises to $62.50, so break-even CPA becomes 62.5 x 40% = $25, equal to today's CPA.
To leave a profit, the target CPA has to sit below break-even. A target of $20 on 40 orders leaves $4 per order, $160 in total.
Using the wrong margin pushes the line too high. If you treat a 55% product margin as contribution margin, break-even CPA comes out at 60 x 55% = $33, which is $9 above the true $24, and scaling to that line loses money. The conversion is built into the site's ROAS calculator, which also covers CPA. The definition of ROAS is in what is ROAS.
Break-even CPA looks at the first order only. If repeat purchase is strong you can include it, but that moves into customer acquisition cost and lifetime value, and the ceiling should be set more cautiously.
Reporting traps
- Platform orders and Shopify orders disagree. Google Ads Help says numbers can differ across platforms because of attribution models and lookback windows. Google's main columns are based on the time of the click, not the time of the conversion, and reporting lag can take up to 24 to 48 hours. The CPA for the last day or two will shift as data fills in, so decide on complete weekly data.
- Windows do not match. CPA under a 7-day click window and a 1-day click window cannot be compared directly, and changing the window mid-test creates fake changes. See attribution window.
- What counts as a conversion. If the platform counts add to cart or checkout starts, the figure you get is cost per add to cart. When you read CPA for a store, limit the conversion event to Purchase.
- The CVR denominator. The platform's CVR divides by ad interactions, while the conversion rate in Shopify often divides by sessions. The two numbers are not interchangeable.
- New and returning customers. CPA counts every conversion, including returning customers. CAC looks only at new customers and is stricter.
- Refunds. For products with heavy refunds, calculate the break-even line on orders net of refunds.
Deeper analysis of CPA and CPM, including placement breakdowns and a profit guardrail table, is in the tutorials CPA Analysis: Acquisition Cost and Profit Guardrails and CPM Analysis: Impression Cost and Traffic Quality.
FAQ
What does CPA mean and how is it calculated?
CPA is the cost of each conversion: ad spend divided by the number of conversions. In ecommerce a conversion is usually an order. Spending $1,000 for 40 orders gives a CPA of 1,000 / 40 = $25. Before you use any figure, confirm which event the platform counts as a conversion.
What is the difference between CPM, CPC and CTR?
CPM is the cost per 1,000 impressions and shows how expensive reach is. CTR is clicks divided by impressions and shows how well the ad earns a click. CPC is the cost per click, set jointly by CPM and CTR, and equals CPM / 1000 / CTR.
Is CPA the same as CAC?
They differ in scope. CPA divides by the number of conversions, so returning customers' orders are included. CAC divides by new customers and usually covers more acquisition cost, such as agency fees and creative production. See customer acquisition cost.
What is a good CPA?
There is no universal number. The test is your break-even CPA, average order value times contribution margin. A CPA below that line makes a profit, and how far below it should be depends on your profit target and cash cycle.
How do I convert between CPA and ROAS?
ROAS = average order value / CPA, and CPA = average order value / ROAS. With a $60 order value and a $25 CPA, ROAS is 2.4. This assumes the revenue in ROAS and the orders in CPA are counted on the same basis.
Next step
Work out your own break-even CPA first: take the average order value of the last 30 days and multiply it by contribution margin after variable costs. Then take one campaign's CPM, CTR and CVR and check that they reproduce its CPA through the chain above. If they do not, look at definitions first. For a ready calculation, use the site's ROAS calculator.
Sources
Last verified: 2026-11-03. Meta Business Help Center metric definition pages only display fully after sign-in, so this article does not quote Meta's metric definitions.
- Google Ads Help: Clickthrough rate (CTR): definition and example, verified 2026-11-03.
- Google Ads Help: Average CPC: definition and example, verified 2026-11-03.
- Google Ads Help: Conversion rate: definition and example, verified 2026-11-03.
- Google Ads Help: Understand your conversion tracking data: cost per conversion, attribution model and lookback window differences, click-time reporting and reporting lag, verified 2026-11-03.
- Google Ads Help: About YouTube ads and view metrics: the average CPM formula, verified 2026-11-03.
- Definitions on this site: ROAS, break-even ROAS, contribution margin, CAC, attribution window.