There are two common repurchase rate definitions. The customer-based one is customers with two or more orders divided by all customers. The order-based one is orders from returning customers divided by all orders. On the same data they can differ by a factor of two, so always state the definition and the time window. Customer lifetime value (LTV) also has three common methods: add up what customers actually spent; multiply average order value by purchase frequency by customer lifespan; or multiply margin by a retention assumption. For budget decisions, use a margin-based version and compare it with customer acquisition cost (CAC). Below, one fictional data set runs through each method, with the Shopify location of every input.
Repurchase rate: choose the definition first
Suppose a store had 2,000 customers place orders in the last 12 months. Of these, 1,540 bought once and 460 bought twice or more. Those 460 customers placed 1,300 orders, so total orders were 1,540 + 1,300 = 2,840, and revenue was $170,400.
| Definition | Formula | Result here | Question it answers |
|---|---|---|---|
| Customer-based | Customers with 2+ orders / all customers | 460 / 2,000 = 23% | Of the people who bought, how many came back |
| Order-based | Orders from returning customers / all orders | 1,300 / 2,840 = about 45.8% | How much of order volume comes from returning customers |
| Repeat order share | Orders after the first / all orders | (2,840 - 2,000) / 2,840 = about 29.6% | How much of order volume is repeat orders |
The order-based version is usually higher, and a few heavy buyers can pull it up. To judge how many people are willing to buy again, use the customer-based version. The three numbers here are 23%, 45.8% and 29.6%; do not compare numbers from different definitions.
A Shopify-specific warning. Shopify's Returning customer rate field is defined as returning customers divided by customers who placed orders, where a returning customer is someone who has purchased before; the earlier order does not have to be inside the selected period. Shopify's customer reports use each customer's whole order history, so a customer whose first order was before your selected period counts as returning when they order again inside it. Check each report's definition before comparing it with a strict two-orders-in-the-window count.
State the time window too. It should fit the replenishment cycle: about 90 days for consumables, 12 months for considered purchases. Once chosen, keep it fixed across reports. An all-history window keeps rising over time, while a window that is too short makes the same store look weak. When cleaning data, exclude non-product transactions such as sample kits or gift card top-ups, as the Polar Analytics article advises. Removing test orders, cancelled orders and fully refunded orders is our own recommended data hygiene; that source does not say it.
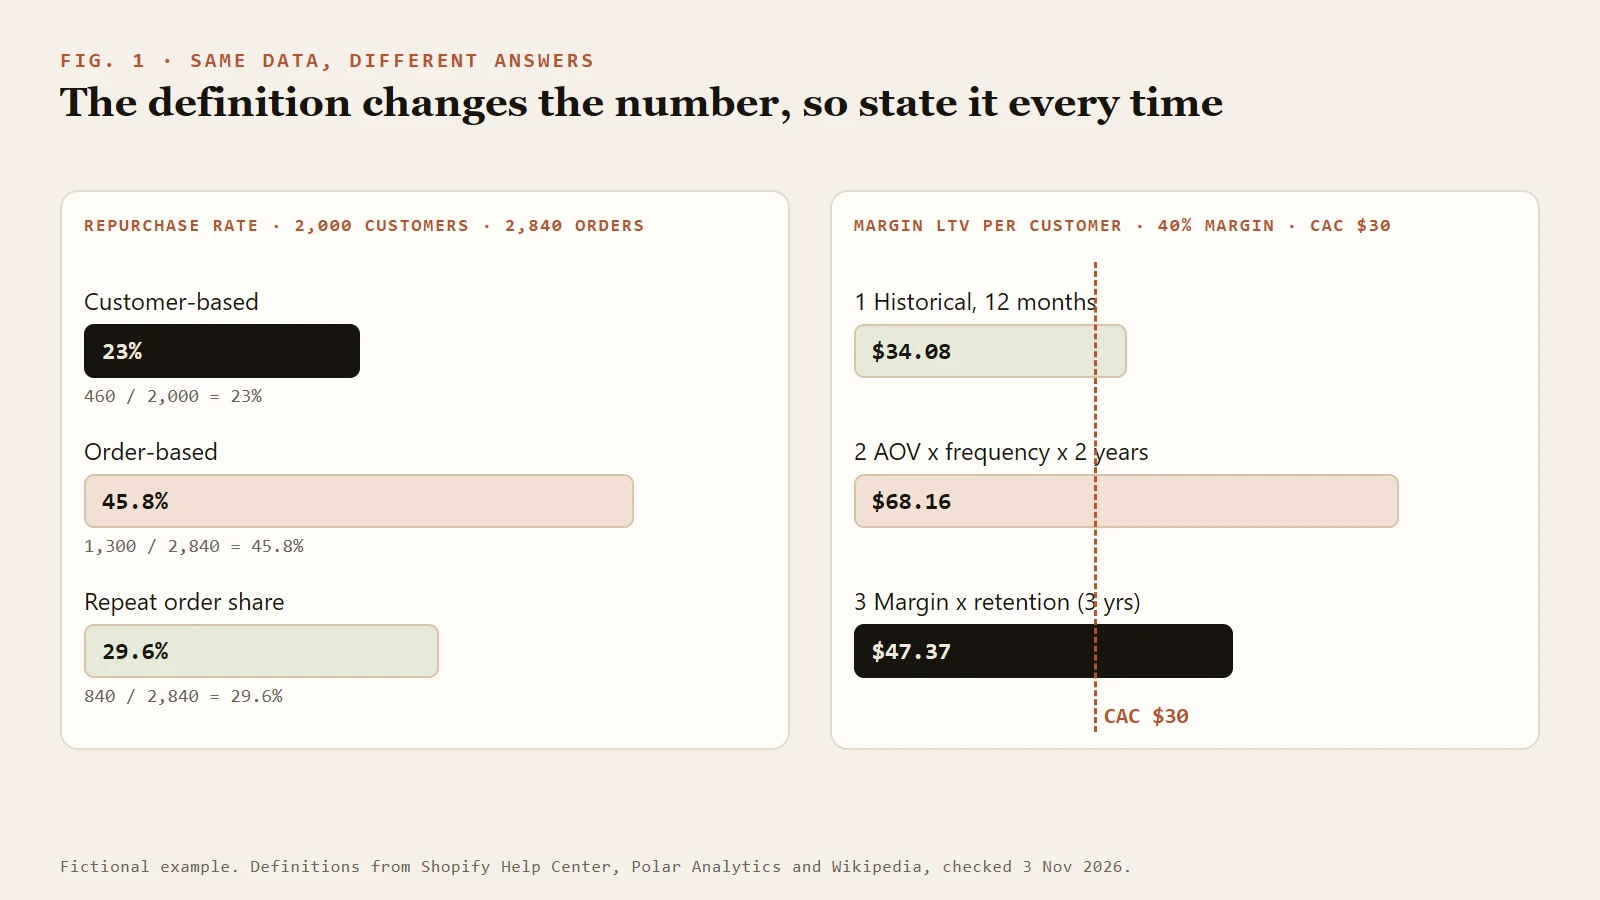
Figure 1: the same data gives different answers under different definitions.
Three LTV methods
All three use the data above and assume a 40% contribution margin (after product cost, shipping, payment fees and refunds). For that margin, see contribution margin.
Method 1: historical total. Average what customers have already spent.
- Revenue per customer over 12 months = 170,400 / 2,000 = $85.20
- Margin per customer over 12 months = 85.20 x 40% = $34.08
This is observed fact and the steadiest number, but it covers only the window you observed and does not predict the value of new customers.
Method 2: average order value x frequency x lifespan.
- Average order value = 170,400 / 2,840 = $60
- Orders per customer per year = 2,840 / 2,000 = 1.42
- Assume a 2-year lifespan: revenue LTV = 60 x 1.42 x 2 = $170.40, and margin LTV = 170.40 x 40% = $68.16
This is double Method 1, because it assumes year two looks like year one. The 1.42 orders in year one include every customer's first order, and a first order only happens once. For a store where most customers buy once, that assumption is optimistic. The lifespan is an assumption you must be able to defend.
Method 3: margin x a retention assumption (our simplified convention). This is not a formula from a published source: it is an undiscounted geometric sum that counts period 1 at full margin. Take one period's margin per customer, then assume a share of customers keeps buying each year. Suppose 30% of customers are retained into the next year and the same share carries on after that (r = 0.3):
- Average lifespan = 1 / (1 - 0.3), about 1.43 years
- Unlimited horizon = 34.08 / (1 - 0.3), about $48.69
- Three years only = 34.08 x (1 + 0.3 + 0.3^2) = 34.08 x 1.39, about $47.37
Take retention from your own cohort data and do not borrow an industry average. After three years the gap to an unlimited horizon is small, so a fixed horizon such as three years is easier to explain.
The three results are $34.08, $68.16 and $47.37. The spread shows how much each method leans on its assumptions. For budget decisions use Method 3, and keep Method 1 in view as a floor.
Connecting LTV to CAC and payback
Suppose CAC is $30 (this month's ad spend divided by new customers).
- First-order margin = 60 x 40% = $24, which is below CAC, so the first order loses $6
- Method 1's 12-month margin of $34.08 gives an LTV to CAC ratio of about 1.14
- Method 3's three-year margin of $47.37 gives about 1.58
Payback comes from the cohort: for customers who made their first order in the same month, find the month when cumulative margin per customer passes CAC. The example has no month-by-month data, so it cannot give a payback month. All it shows is that the store roughly breaks even within 12 months.
You will often see "LTV to CAC of at least 3" in marketing posts. The source we could find is David Skok's article on SaaS businesses, which calls it a guideline and says there are cases where it makes sense to break it. It comes from subscription businesses, whose margin structure and repeat rhythm differ from ecommerce. Treat it as a common rule of thumb with no standard status. Check first whether your own payback period is bearable, then decide whether to use it at all.
Where to find the inputs in Shopify
| Input | Where in Shopify | Limit |
|---|---|---|
| Customer counts, first-time and returning customers | Analytics > Reports, customer reports: New vs returning customers, Returning customers (two or more orders), One-time customers (exactly one order) | Uses each customer's entire order history |
| Repeat purchase rhythm and retention | Customer cohort analysis: groups by first order date by default; metrics include number of customers, Customer retention rate, sales, average order value and Amount spent per customer | Period 0 records repeat orders in the same period as the first order |
| Average order value | AOV field = (gross sales - discounts) / orders | Excludes post-order adjustments |
| Gross margin | Gross margin = gross profit / net sales; Cost per item must be filled in first | Orders without a recorded cost are left out of gross profit |
| Projection | The Show projections toggle in the cohort report; Predicted spend tier is a separate report | Show projections works only with the Amount spent per customer metric and uses the cohort's previous 24 months of data; Shopify says projections are not a guarantee of future sales. Predicted spend tier shows the predicted value of each customer in the selected cohort |
Shopify's report documentation has no LTV field. The nearest are Amount spent per customer and Predicted spend tier, so LTV is something you calculate. CAC does not live in Shopify; take it from ad platform spend and new customer counts.
Reading data in cohorts
A cohort is a group of customers who made their first order in the same month. Give each cohort its own row and read across: how that group repurchased and how much it spent cumulatively in each following month or quarter.
- A new cohort has not had time to repurchase. Do not read its low repeat rate as a decline; compare once it has aged.
- Separate customers whose first order used a discount from full-price customers. Promotion-driven customers often do not repurchase at full price.
- Compare cohorts from different months over the same observation window.
This is a general way to read the table; the numbers must come from your own cohort report.
Common mistakes
- Using the whole store's history as LTV. New customers may differ in quality from older ones.
- Calculating LTV from revenue. A revenue LTV flatters customers who bought once on discount; margin LTV is the one comparable with CAC.
- Setting the lifespan to three or five years without testing it against data.
- Reading Shopify's Returning customer rate as the share of customers with two orders inside the window.
- Using an optimistic LTV to justify unprofitable acquisition before retention is proven. A new store should first make first-order economics hold.
FAQ
How do I calculate repurchase rate?
The most common is customer-based: customers with two or more orders divided by all customers. The order-based version is orders from returning customers divided by all orders, and it gives a higher number. Whichever you use, state the time window and exclude non-product transactions such as samples. We also recommend removing test, cancelled and fully refunded orders.
What is a good repurchase rate?
There is no universal standard. Product type, replenishment cycle and time window all change the number. We did not find an authoritative general benchmark, so we do not recommend borrowing one. It is more practical to watch the trend across your own cohorts.
Should LTV be based on revenue or profit?
For operating and budget decisions use gross margin or contribution margin. Revenue LTV flatters customers who bought once on discount and cannot be compared directly with CAC.
Does Shopify give me LTV directly?
The documentation has no LTV field. Customer cohort analysis shows cumulative spend per customer for each cohort, offers a projection based on 24 months of data, and there is a Predicted spend tier, but you still have to combine these with margin and CAC yourself.
How many times CAC should LTV be before I advertise?
No single number fits every store. "At least 3" is often quoted, from an experience-based guideline for subscription businesses that its author describes as a guideline only. Ecommerce also depends on margin, payback and cash. Work out the payback month first, then decide the budget.
Keep reading
- Definitions: What is LTV, What is repurchase rate, What is CAC, What is AOV
- Tool: ROAS calculator
- Profit: ROAS Is Not Profit: Why Ad Reports Can Look Good While Cash Shrinks, Break-Even ROAS vs Platform ROAS
- Topic: ROAS, profit and cash flow
- Deeper lessons: SKU profit, Lifecycle email (members)
Sources
Last verified 2026-11-03. Every number in the examples comes from a fictional store and exists to show the method; none describes a real store or an industry level.
- Shopify Help Center: Customers reports
- Shopify Help Center: Analytics fields reference
- Wikipedia: Customer lifetime value (general background on LTV; Method 3 above is our own simplified convention)
- Polar Analytics: Repeat purchase rate in ecommerce
- David Skok, For Entrepreneurs: SaaS metrics 2.0