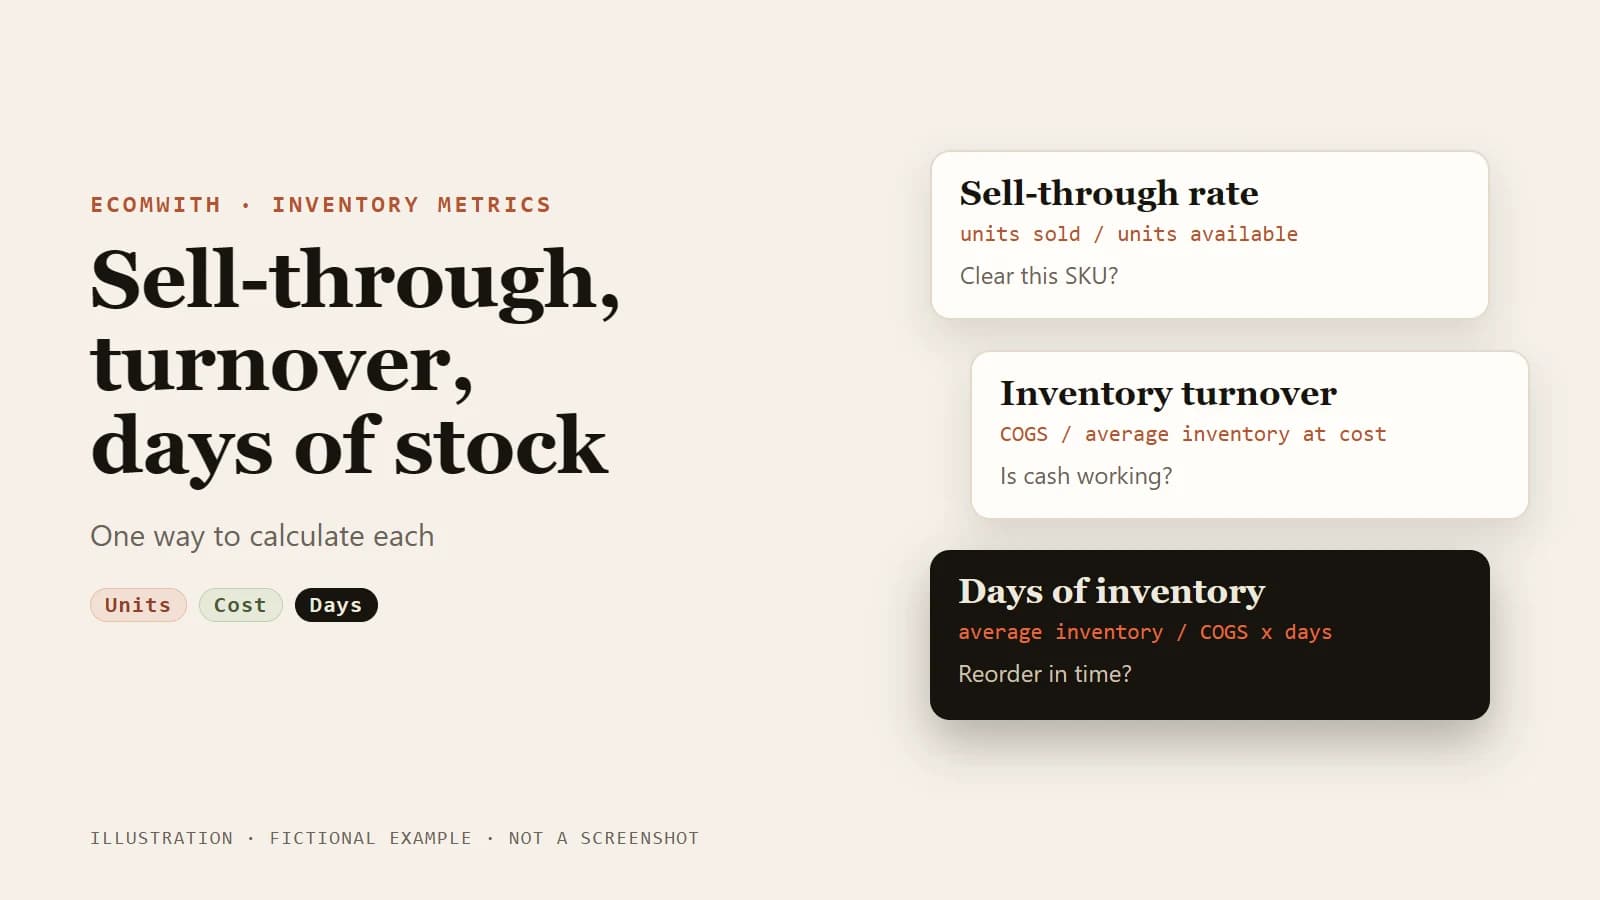
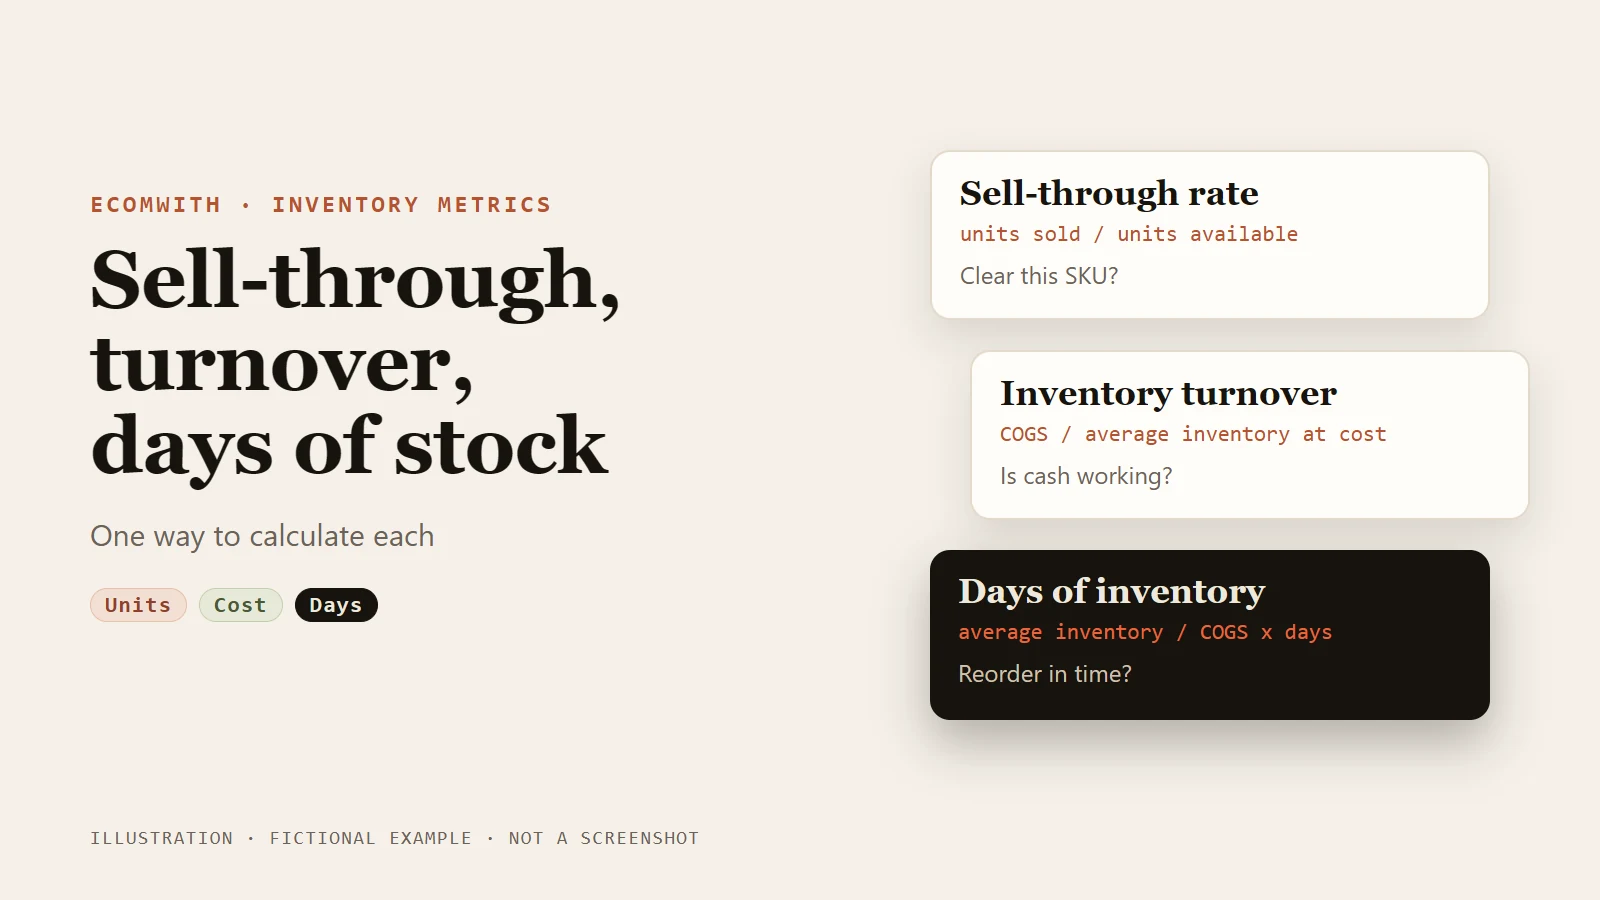
These three metrics answer three different questions. Sell-through rate shows how much of a batch of stock has sold, and it drives markdown and clearance decisions. Inventory turnover shows how many times the whole stock cycled in a period, which tells you how efficiently cash is tied up in goods. Days of inventory turns that into days, and it drives reorder timing. The part that goes wrong most often is the sell-through denominator: sources use three different ones, and the results differ widely. A small store can standardize on one: per SKU or variant, over a fixed 30-day window, units sold divided by (opening units plus units received). Turnover and days of inventory should be calculated at cost. Below are the three denominators, one worked example, and where each input lives in Shopify.
The three metrics side by side
| Metric | Question it answers | Unit and scope | Formula |
|---|---|---|---|
| Sell-through rate | How much of this batch or SKU has sold; should I clear it | Units; SKU, variant or one buy | Units sold / units available to sell |
| Inventory turnover | How many times did stock cycle in the period; how efficient is the cash in goods | Cost value; whole store or category | Cost of goods sold / average inventory at cost |
| Days of inventory | How many days does stock take to sell, or how many days will current stock last | Days; store, category or SKU | Average inventory / COGS x days in period; or ending units / average units sold per day |
Three denominators for sell-through
English-language sources use the same three, and none is the single standard.
| Version | Formula | Typical use | Problem |
|---|---|---|---|
| Opening inventory plus received | Sold / (opening + received) | A fixed period in which you may restock | You need both the opening count and the receipts |
| Received only | Sold / received | One season or one purchase order: how much of this buy has cleared | If older stock is selling at the same time, sold units include old stock and the result can pass 100% |
| Opening only | Sold / opening | A period with no restocking | If you restock mid-period the denominator is too small and the result too high |
Some sources say any denominator works as long as you use it consistently across reports. Sources divide by different things: some by units received, some by beginning inventory plus units received. The same sales can therefore give very different rates, so state the method whenever you share a figure.
Shopify's Products by sell-through rate report uses sold / (sold + still in inventory). When stock changes only through sales and receipts, that equals the "opening plus received" version, because opening plus received minus sold is the ending stock, so sold plus ending stock is everything that was available.
Recommendation: for routine work use the first version per SKU or variant. To judge one purchase order or one season, add the second version and count only the units sold from that batch. Write the method next to every report.
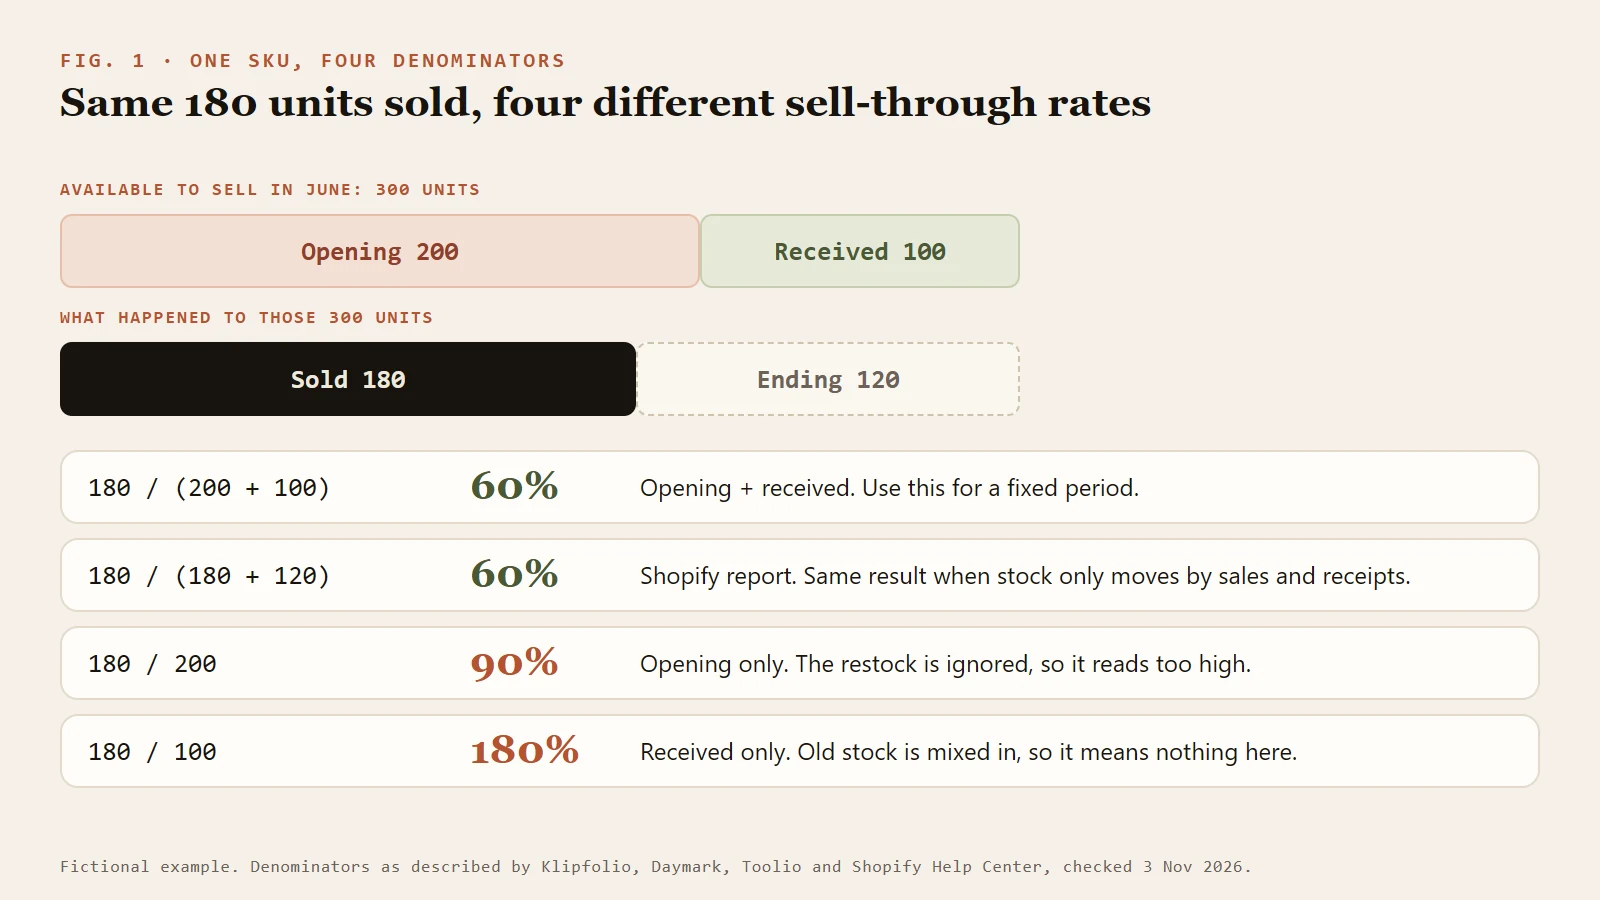
Figure 1: the same 180 units sold give different rates when the denominator changes.
A worked example
Take a fictional T-shirt SKU in June (30 days):
| Item | Units |
|---|---|
| Opening stock on June 1 | 200 |
| Received mid-June | 100 |
| Sold in June | 180 |
| Ending stock on June 30 | 200 + 100 - 180 = 120 |
Results:
- Opening plus received: 180 / (200 + 100) = 60%
- Shopify's formula: 180 / (180 + 120) = 60%, the same
- Opening only: 180 / 200 = 90%, which ignores the restock and reads too high
- Received only: 180 / 100 = 180%, because old stock is mixed in, so the number has no meaning
If those 100 units are a separate purchase and you want to know how that batch is doing, count only units sold from it. Suppose 260 of a new 400-unit batch have sold: 260 / 400 = 65%.
Now the whole store. Suppose June cost of goods sold (COGS) was $18,000, inventory at cost was $30,000 on June 1 and $24,000 on June 30:
- Average inventory = (30,000 + 24,000) / 2 = $27,000
- Turnover for the month = 18,000 / 27,000, about 0.67 turns
- If June is typical, about 0.67 x 12 = 8 turns a year
- Days of inventory = 27,000 / 18,000 x 30 = 45 days
Using 365 / 8 gives 45.6 days, slightly different from 45, because one uses a 30-day month and the other a 365-day year. Both conversions are common. Choose one and keep it fixed.
Finally, how long will stock last? The T-shirt has 120 units at the end of June. If it sold 168 units over the last 28 days, that is 168 / 28 = 6 units a day, and 120 / 6 = 20 days of stock. If a reorder takes 35 days to arrive, ordering now is already late. The 35 days is an assumption for the example; use your supplier's real lead time.
Making turnover and days of inventory consistent
- Use cost of goods sold as the numerator and inventory valued at cost. Both sides should share one price basis. Dividing COGS by inventory valued at retail price distorts the result.
- The simplest average inventory is opening plus ending, divided by two. If stock swings or the business is seasonal, average the month-end balances instead.
- Some data providers use sales instead of COGS as the numerator. That variant is mainly for comparison with outside data. For your own decisions the cost version is closer to reality.
- Compare turnover only within the same industry. Product mix, discounting and supply chain all change the number.
Where to find the inputs in Shopify
Sell-through and days of stock. In Analytics > Reports, filter by category Inventory.
- Products by sell-through rate: the formula above, over the most recent 30 days available, usually with about a 2-day processing delay. Negative inventory is ignored, untracked products count as 0 sold, and a variant appears only if it has sold at least once before or during the period.
- Inventory remaining per product (the column is labelled Days of inventory remaining): ending quantity divided by average quantity sold per day, with the daily average based on the last 28 days. A variant with no sales shows N/A and a negative ending quantity shows 0. It uses 28 days while sell-through uses 30, so the two reports have different windows.
- ABC analysis: grades variants by share of revenue over the last 28 days. A is the top sellers making up about 80% of revenue, B the next 15%, C the last 5%. Item cost does not affect the grade.
From October 1, 2026 Shopify inventory reports measure On hand quantity instead of Available; earlier data still shows Available. Watch for that change when you compare periods across the date. Inventory-based historical data exists only from October 1, 2023.
Cost of goods sold. Enter Cost per item on your products. In Shopify's finance reports only net sales with cost recorded go into the Cost of goods sold report and into gross profit, so orders without a recorded cost are left out. The Gross profit breakdown card in Finance Summary shows how much of net sales has a cost and how much does not.
Inventory at cost. Export the product CSV. It has Cost per item and Inventory quantity columns; multiply them row by row and add them up. Inventory quantity applies only to stores with a single location; with several locations, use the inventory CSV.
Which one to use when
| Decision | Metric | What to look at |
|---|---|---|
| Mark this SKU down or clear it | Sell-through rate | Trend over several periods for the same SKU, against your own plan curve |
| Is this buy clearing fast enough; buy again? | Batch sell-through (received basis) | Units sold from the batch / units received |
| Is cash tied up in stock; is efficiency improving? | Inventory turnover | Monthly and annualized, against your own history |
| Can I still reorder in time? | Days of stock (ending units / daily sales) | Compare with supplier lead time and production or shipping time |
| How much working capital does stock hold? | Days of inventory (average inventory / COGS x days) | Compare with your payment terms |
Common mistakes
- Treating a high sell-through rate as success. It ignores price. A deep discount sells fast and can erase margin, so read it next to gross margin.
- A sold-out product cannot go above 100%, so unmet demand is invisible in the number.
- Measuring too early. Stock that arrived late in the window has had little time to sell, and a short window makes healthy stock look slow.
- Assuming higher turnover is always better. Very high turnover can mean thin stock and a risk of stockouts and lost sales.
- Comparing Shopify's 28-day and 30-day reports as if they shared a window.
- Applying another company's turnover benchmark to your own store. Industries differ a great deal.
FAQ
What is the difference between sell-through rate and inventory turnover?
Sell-through is in units and answers "how much of this batch has sold", which suits SKU-level clearance and reorder decisions. Inventory turnover is in cost value and answers "how many times did the whole stock cycle", which shows cash efficiency. A brand can have strong sell-through on its hero products and still have low turnover, because slow SKUs drag the average down.
What is a good sell-through rate?
There is no universal standard. Category, season and replenishment pace all change the target. English-language sources give different examples: one uses 60% as a worked example of a healthy rate and calls 20% a common threshold for concern, and the numbers do not transfer across different denominators. A more reliable approach is to set a planned sell-through curve for each SKU and watch for deviation.
Is higher inventory turnover always better?
Usually higher is read as good, because stock sells faster and holding costs are lower. A very high figure can also mean stock is too thin and stockouts are likely. Watch the trend, and compare only with the same industry and the same method.
How do I calculate days of inventory, and is it the same as Shopify's days remaining?
No. The accounting version looks backward: average inventory / COGS x days in the period, showing how long stock takes to sell. Shopify's Inventory remaining per product looks forward: ending units / average units sold per day over the last 28 days, showing how long current stock will last. The forward version is the one to use for reordering.
I have not entered cost prices. How can I calculate turnover?
Add Cost per item first; it is the most reliable route. As a stopgap you can divide net sales by average inventory valued at selling price, which is a documented variant, but it is rougher. Use it for trends only, and never compare it with a cost-based figure.
Keep reading
- Definitions: What is sell-through rate, What is inventory turnover, What is days of inventory, What is gross margin
- Tool: Pricing calculator
- Profit and cash: 90-Day Cash Runway For A New Ecommerce Store, Calculate Real Ecommerce Profit Before Pricing, Discount vs Bundle Margin Guide
- Topic: ROAS, profit and cash flow
- Deeper lessons: Cash and inventory, Inventory planning (members)
Sources
Last verified 2026-11-03. Shopify may rename or change its reports, so open the report page to confirm before relying on a definition.
- Shopify Help Center: Inventory reports
- Shopify Help Center: Product analytics
- Shopify Help Center: Finance reports
- Shopify Help Center: Using CSV files to import and export products
- Klipfolio: Sell-through rate
- Daymark: Sell-through rate
- Toolio: Sell-through rate
- Wikipedia: Inventory turnover
- Corporate Finance Institute: Inventory turnover